

Understanding Power Query:
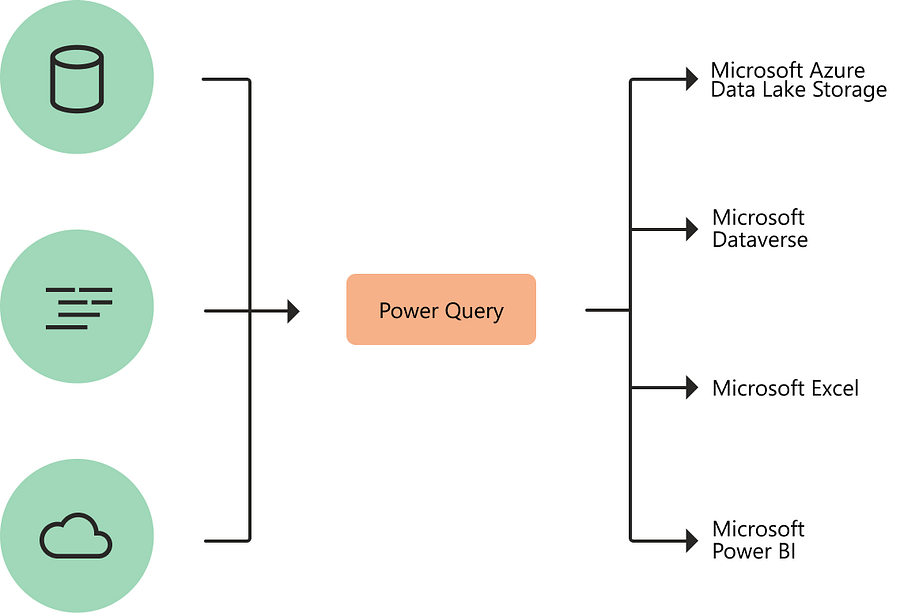
Power Query is a data transformation tool that is included in Power BI. It allows users to connect to various data sources, apply data transformations, and load the cleaned and shaped data into the data model for analysis. Power Query uses a graphical user interface and a functional language called M to perform these operations.
Connecting to Data Sources:
To start transforming data in Power BI, you first need to connect to your data source. Power Query supports a wide range of data sources, including Excel files, databases (SQL Server, MySQL, etc.), SharePoint lists, web pages, cloud-based services (such as Azure and Google Analytics), and many others. The “Home” tab in Power BI Desktop houses the “Get Data” button, which allows you to select the desired data source.
Cleaning and Filtering Data:
After connecting to a data source, it’s common to encounter dirty or incomplete data. Power Query provides a plethora of data cleaning and filtering options. You can remove duplicate rows, filter out irrelevant data, remove null or missing values, and replace incorrect data with correct values. The “Transform Data” button in Power Query Editor takes you to the data transformation window, where you can apply these operations.

Splitting and Merging Columns:
In many cases, data might be stored in a single column, but you need to split it into multiple columns for analysis. Power Query allows you to split columns based on delimiters, fixed width, or other conditions. Conversely, you can merge multiple columns into a single column using custom separators.
Transforming Text and Dates:
Power Query offers several text-specific functions for transforming and cleaning text data. You can change case (upper, lower, proper), remove leading or trailing spaces, and extract specific substrings from text columns. For date columns, you can extract components like year, month, and day or convert text to date format.
Applying Conditional Transformations:
Conditional transformations are powerful techniques to clean and shape data based on specific conditions. With Power Query, you can create custom columns using conditional statements, such as IF-THEN-ELSE logic, to categorize or calculate values based on specific criteria.
Refreshing Data and Scheduling:
Once you have transformed your data in Power Query, you can publish your Power BI training report to the Power BI Service and set up data refresh schedules. Data refresh ensures that your reports stay up-to-date with the latest data from your data sources.
Conclusion:
Data transformation is a critical step in the data analysis process, and Power Query in Power BI provides an intuitive and powerful environment to accomplish this task. By leveraging its extensive data transformation capabilities, users can clean, shape, and prepare data for meaningful analysis and visualization. Understanding and mastering Power Query empowers users to turn raw data into actionable insights, making Power BI a formidable tool for data-driven decision-making in any organization. As you continue your journey with Power Query, don’t hesitate to explore new features, experiment with various transformations, and engage with the Power BI course community to enhance your data transformation skills and unleash the full potential of your data analysis endeavors, data analyst course

You must be logged in to post a comment.